United Nations Development Programme (UNDP) states that, “By 2030, substantially reduce the number of deaths and illnesses from hazardous chemicals and air, water and soil pollution and contamination”, as a target for the Goal-3 of Sustainable Development Goals (SDGs) i.e., Good Health and Well Being.
In India, most major cities have poor Air Quality Index. As per the Air Report released by WHO, 1 out of 8 deaths are due to air pollution.
Based on international reports like these, India introduced programmes to manage pollution such as National Clean Air Programme (2019) to reduce PM 2.5 and PM 10 levels, Bharat Stage VI Norms (2019) to regulate the emissions from Automobile Engines.
Causes of Air Pollution
- Vehicle Emissions
- Industries
- By products of Manufacturing and Power generation
- Agricultural (like stubble burning) and Mining Activities
- Domestic usage of fuels etc.,
The point source of the pollutants can be located can be easily mapped with GIS tools. It helps to effectively analyse, visualize, and manage air pollution data to gain insights into pollution patterns, trends and impacts on the environment and human health.
Air Pollution in India
India is 3rd largest Green House Gas (GHG) emitter even though the per capita emission is comparatively low. So, it is crucial to record and monitor the emissions from various sources.
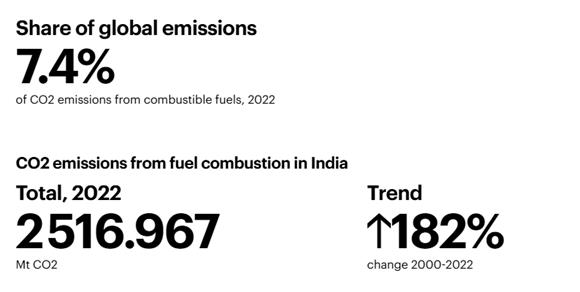
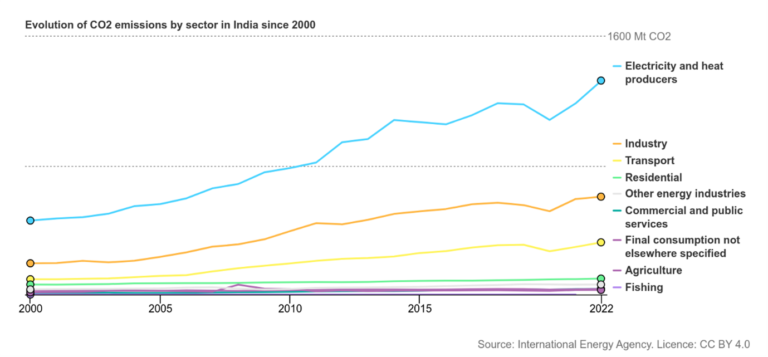
Central Pollution Control Board of India is monitoring National Ambient Air Quality Standards for 12 major air pollutants to assess the level of air pollution and act if necessary.

The levels of these pollutants can be measured using Air Pollution Monitoring Equipment along with spatial information.
ArcGIS for Air Pollution Data
Data Integration
ArcGIS allows the integration of data from external sources such as government agencies or research institutions with various formats. The data can be imported from spreadsheets or databases and can be published as web services, REST services. Real-time data feeds are possible for monitoring and analysis.
Data Management
ArcGIS Pro and other services provide tools for managing air pollution data effectively. New datasets can be created either in Vector or Raster format. Existing datasets can be combined for effective analysis.
Analysis
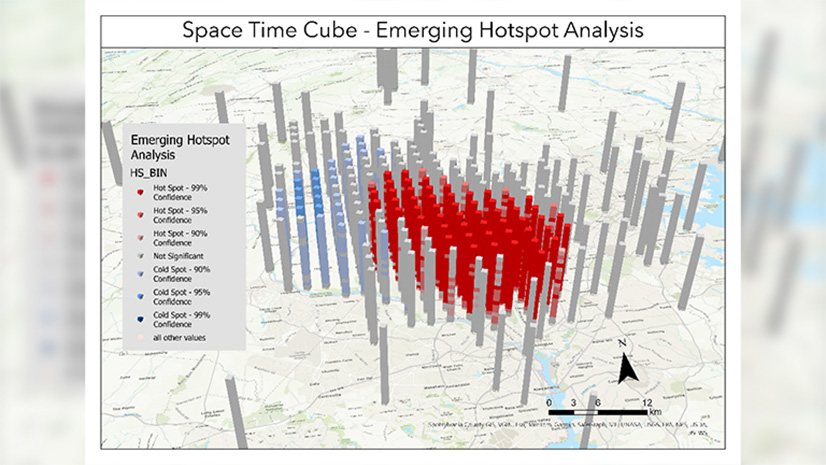
ArcGIS provides variety of spatial analysis tools to perform on air pollution data and get insightful results. Some of the tools are Overlay Analysis, Proximity Analysis, Hotspot Analysis.
Data Interpolation
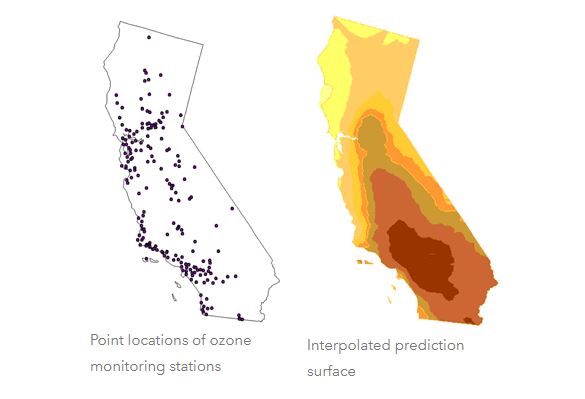
Interpolation is an important analysis tool in air pollution analysis. Spatial Analysis – Interpolation tools are more helpful to create a dataset representing the measurements taken.
The Geostatistical Analyst extension for ArcGIS Pro offers advanced tools for spatial interpolation, which can be particularly useful for analysing air pollution data and predicting pollution levels at unsampled locations.
Raster Analysis
ArcGIS contains tools for raster analysis of air pollution data with grid-based datasets. Various raster operations, such as overlay analysis, suitability analysis and change detection can be performed to analyse and visualize air pollution patterns over
time and space.
Analysis Automation
Python scripting is well supported in ArcGIS environment which helps to automate repetitive tasks and customize analysis workflows. Using the scripts, custom analysis can be performed on air pollution data for specific requirements.
Visualizing and Monitoring for better Decision Making
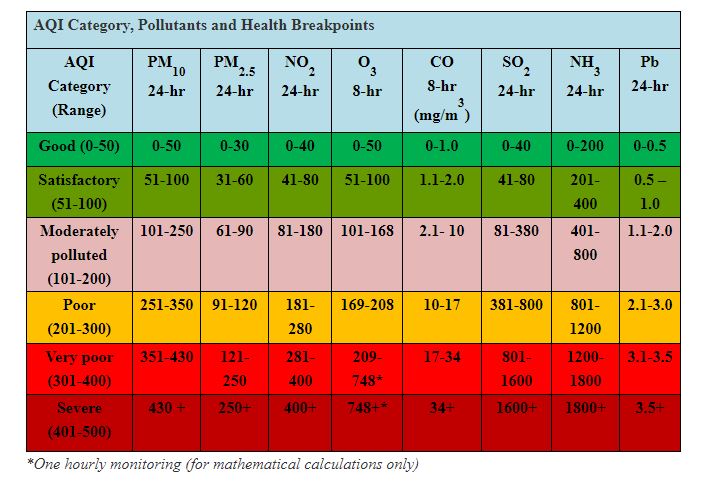
India has National Air Quality Index to effectively communicate the air quality standards to people and decision makers to be well informed about the severity of the pollution levels.
Maps
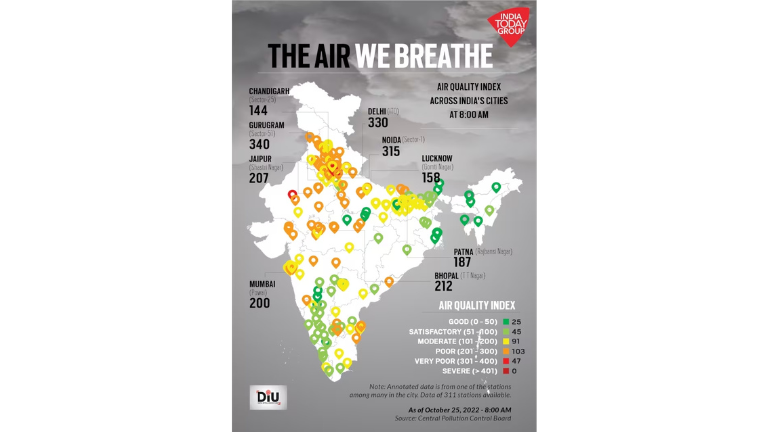
Air Quality Index maps can be created with similar colour schema using colour codes to precisely present the Air Quality across the country. Severely affected areas could be spotted quickly and measures can be taken. Web maps and Webscenes can be created to view in 3D.
Dashboards
Detailed, Interactive and well-defined dashboards can be created for stakeholders with specified requirements to monitor the air quality conditions. Even the pollutant level information for each monitoring station can be made available to the concerned authorities.
Symbols and Themes
Most suited and appropriate symbols are available in ArcGIS mapping tools to render the maps. For example, Air Quality meters, Animated symbol, Heatmaps can be used to depict the actual pollution levels. Also,3D visualization of data can be done.
Control Measures for Air Pollution
The control measures for air pollution includes:
- Minimizing the use of private vehicles and promotion of using public transport.
- Switch to Green/ Clean Energy sources.
But controlling the existing emission level is more important because switching to other measures may be time taking.
Optimizing vehicle routes can reduce considerable amount of fuel consumption and well as Green House Gas Emissions.
Network Analysis
ArcGIS Network Analysis extension provides powerful functionality tools for optimizing the vehicle routes. Route analysis can be used to find shortest routes/ least-cost routes. Service Area Analysis, Closest facility analysis are also useful to plan better for providing transportation services.
Vehicle Routing Problem
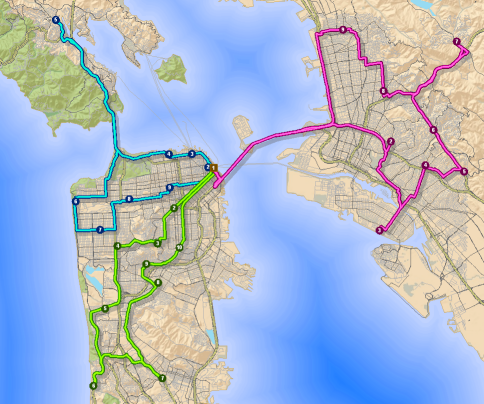
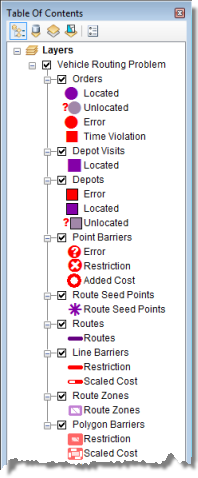
ArcGIS Network Analysis extension enables to create a vehicle routing problem. It is a type of network analysis for routing a fleet of vehicles to serve a set of orders. The analysis helps in reducing vehicle travel duration with multiple vehicle capacities in turn minimizing the GHG emissions.
All service providers involved in transportation can leverage this tool and plan optimal routing for their vehicles. It has the most potential to reduce the emissions with existing infrastructure, while shifting towards green energy sources.
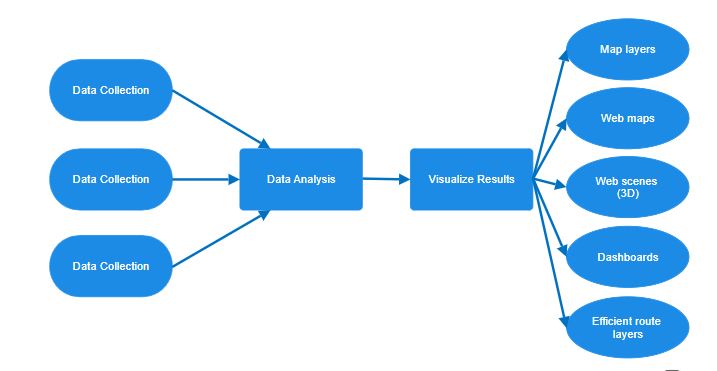
Along with the measures taken by governments and authorities, GIS can help to make informed decisions, provide solutions for some of the control measures and monitor the progress made. By reducing the emission, the major air pollution factors can be addressed as well as the effect of Global Warming can also be reduced.

I am a web application developer specializing in GIS solutions at Esri India, with a keen interest in leveraging GIS technology to address environmental challenges.
