Understanding trends in space and time has become so important in our daily lives. Be it district-wise crop yield across a state, understanding performance of a stock over time, or even the trend of Covid-19 cases across a region, deciphering patterns in the data becomes pivotal for making decisions.
With tremendous amounts of data being made available, it is possible to map such trends. ArcGIS Pro has a suite of ‘Space Time Pattern Mining Tools’, which makes visualizing patterns of time and space very convenient.
One way to do this would be a ‘Space Time Cube’, which is essentially a data structure that can represent spatio-temporal data. A space-time cube (Figure 1) is capable of displaying variations across time and geographical locations in the form of a 3-D cube.
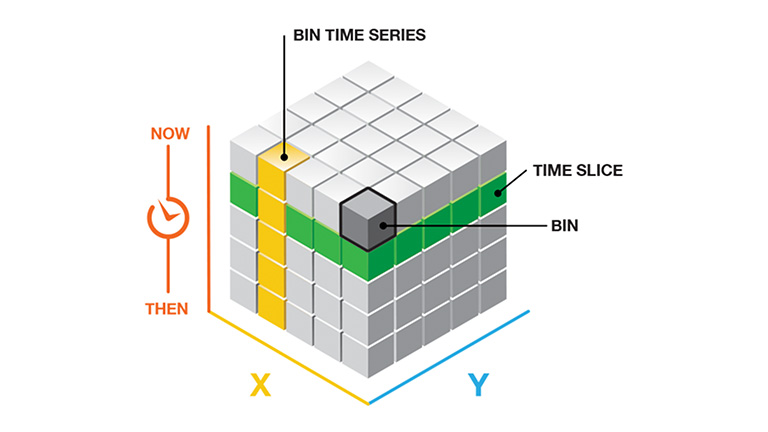
In a Space Time Cube, each “bin” is like a small box that holds data for a specific place and time. A “time slice” is a layer in the cube showing data at a particular moment. The “X” and “Y” axes represent locations on a map, while the “Z” axis represents time, showing how things change over time and across different places. Together, they help us see how patterns unfold in both space and time.
Creating a Space Time Cube in ArcGIS Pro
- Getting the data in the correct format
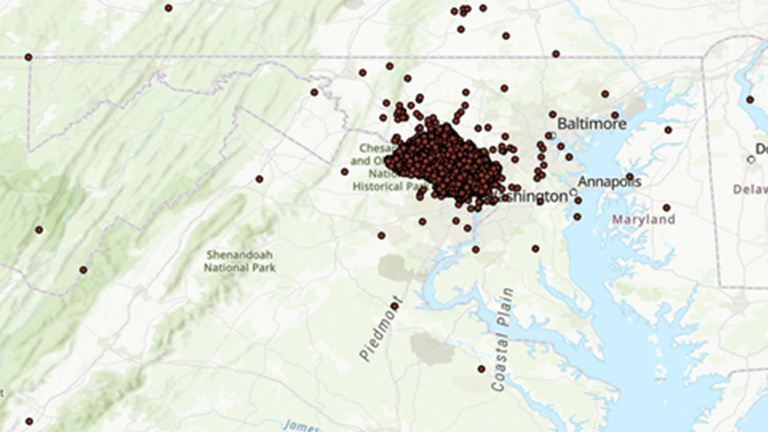
It is important to note that to create a Space Time Cube, a Point feature class is needed, with the appropriate time information as well. Also, make sure that the points layer has a projected co-ordinate system. The point data in Figure 2 represents each collision and details of all traffic collisions occurring on county and local roadways within Montgomery County, for 8 years. (Source: Data.gov)
2. Create a space time cube
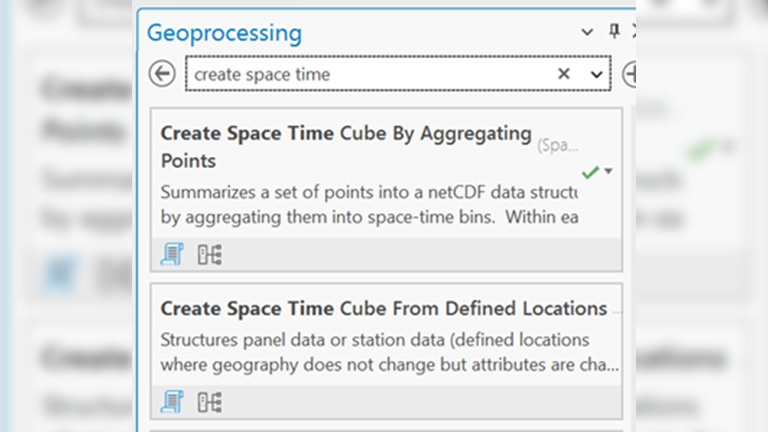
Based on the requirement, a space time cube can be created in 2 ways, either by aggregating points or from defined locations (Figure 3).
‘Create Space Time Cube From Defined Locations’ can be opted when the geography is not varying, but only the values are varying. This can be done when there are fixed points where data is being generated over time.
However, when there is data which represents certain incidences over time, it is sensible to aggregate points over a certain distance.
3. Visualize Space Time Cube in 3-D:
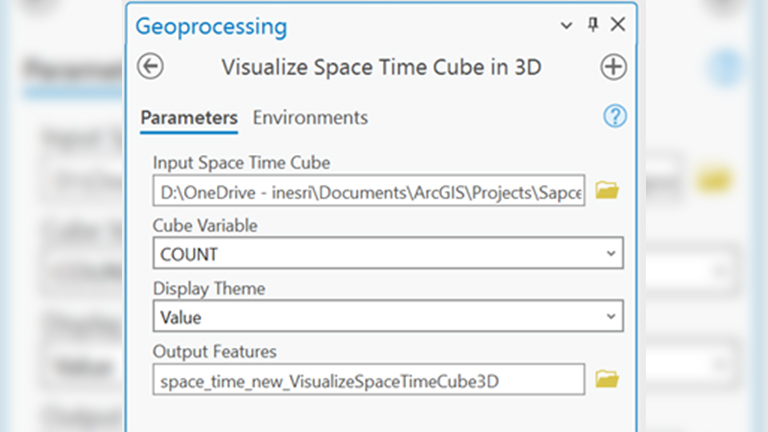
Once a space time cube has been created, the space time cube can be visualized in 3D (Figure 4).
The space time cube can be viewed in 3D in a local scene (Figure 5). The darker values of bins represent a greater number of incidences in that
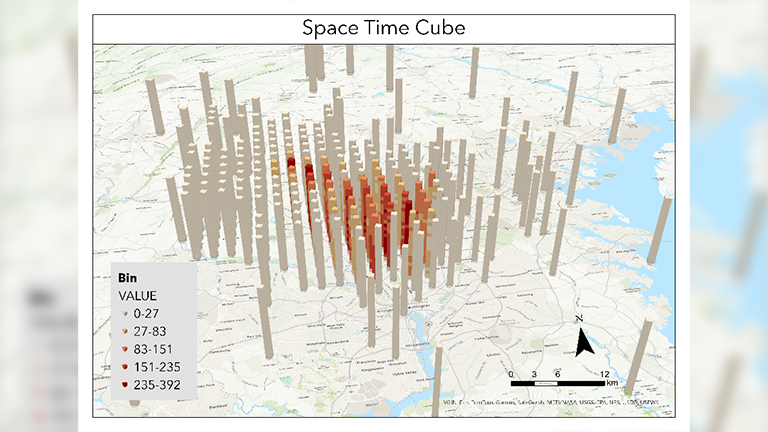
place and time. This visualization is useful to understand the scenario of traffic collisions in Montgomery County over a period of 8 years.
While this gives a good understanding of traffic collisions over space and time, no trend as such is visible. Understanding trends over time can be helpful for decision makers to implement measures to reduce accidents. This trend can be found out using Emerging Hotspot Analysis (Figure 8).
Emerging Hotspot Analysis identifies trends in the clustering of point densities (counts) or values in a space-time cube created using either the Create Space Time Cube by aggregating points, create space time cube from defined locations or create Space Time Cube from Multidimensional Raster Layer tool. Categories include new, consecutive, intensifying, persistent, diminishing, sporadic, oscillating, and historical hot and cold spots (ArcGIS Pro Documentation). It helps detect emerging trends or hotspots in spatial data, indicating areas where there’s a sudden increase or decrease in some phenomenon compared to the surrounding areas.
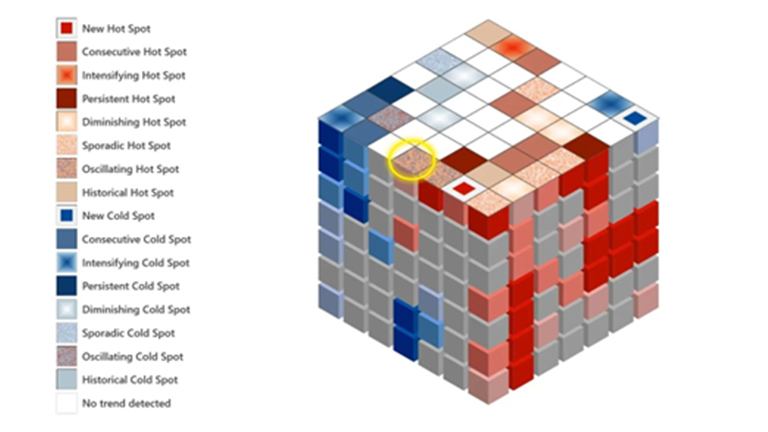
It helps detect emerging trends or hotspots in spatial data, indicating areas where there’s a sudden increase or decrease in some phenomenon compared to the surrounding areas.
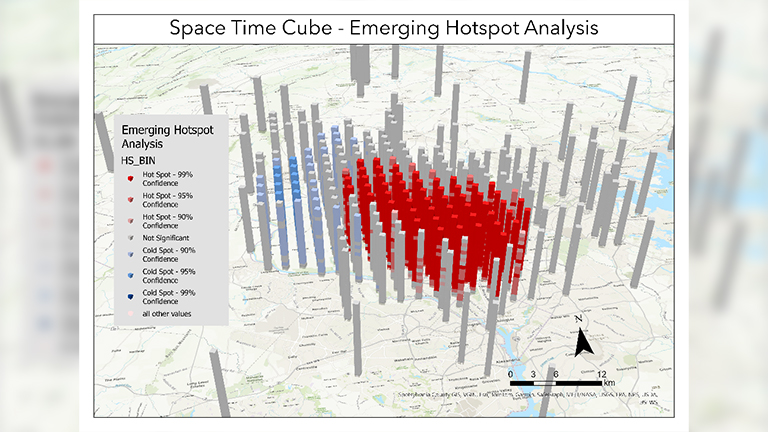
Hotspots and coldspots are identified in the Montogomery data with the help of emerging hotspots analysis (Figure 7).
Key Takeaways:
Understanding spatiotemporal trends is crucial for decision-making in various fields, and ArcGIS Pro’s Space Time Pattern Mining Tools facilitate this by visualizing patterns in time and space. The Space Time Cube, a 3D data structure, represents variations across geographical locations and time using bins and time slices, with the X and Y axes for locations and the Z axis for time. Creating a Space Time Cube requires properly formatted point feature data, and it can be visualized in 3D to reveal patterns like traffic collisions over time. Emerging Hotspot Analysis further aids by identifying trends and significant changes, categorizing areas as new, intensifying, or diminishing hotspots, thus providing deep insights into evolving spatial data patterns.

I enjoy combining the art of storytelling with the science of cartography, sometimes to inspire change and other times just for fun! At Esri India, I create applications that enable clients to make smart 'spatial' choices.
